|
EXACT'09 results
Evaluation results, detailed description of the dataset and the evaluation framework is available in:
P. Lo, B. van Ginneken, J.M. Reinhardt, Y Tarunashree, P.A. de Jong, B Irving, C Fetita, M Ortner, R Pinho, J. Sijbers, M Feuerstein, A Fabijanska, C Bauer, R Beichel, C.S. Mendoza, R. Wiemker, J. Lee, A.P. Reeves, S. Born, O Weinheimer, E.M. van Rikxoort, J Tschirren, K Mori, B Odry, D.P. Naidich, I.J. Hartmann, E.A. Hoffman, M. Prokop, J.H. Pedersen and M. de Bruijne, "Extraction of Airways from CT (EXACT’09)", in IEEE Transactions on Medical Imaging, vol. 31, pp. 2093-2107, 2012
[link][PDF]
The table below shows the average results of the participating teams, with links to the renderings and description of the individual teams.
| Category | Branch count | Branch detected (%) | Tree length (cm) | Tree length detected (%) | Leakage count | Leakage volume (mm3) | False positive rate |
| | CADTB | Automated | 91.1 | 43.5 | 64.6 | 36.4 | 2.5 | 152.3 | 1.27
|   | | ARTEMIS-TMSP | Automated | 157.8 | 62.8 | 122.4 | 55.9 | 12.0 | 563.5 | 1.96
|   | | UAVisionLab | Interactive | 74.2 | 32.1 | 51.9 | 26.9 | 4.2 | 430.4 | 3.63
|   | | NagoyaLoopers | Automated | 186.8 | 76.5 | 158.7 | 73.3 | 35.5 | 5138.2 | 15.56
|   | | DIKU | Automated | 150.4 | 59.8 | 118.4 | 54.0 | 1.9 | 18.2 | 0.11
|   | | VOLCED | Interactive | 77.5 | 36.7 | 54.4 | 31.3 | 2.3 | 116.3 | 0.92
|   | | TubeLink | Automated | 146.8 | 57.9 | 125.2 | 55.2 | 6.5 | 576.6 | 2.44
|   | | Sevilla | Interactive | 71.5 | 30.9 | 52.0 | 26.9 | 0.9 | 126.8 | 1.75
|   | | PhilipsResearchLabHamburg | Automated | 139.0 | 56.0 | 100.6 | 47.1 | 13.5 | 368.9 | 1.58
|   | | VIA | Automated | 79.3 | 32.4 | 57.8 | 28.1 | 0.4 | 14.3 | 0.11
|   | | ICCAS-VCM | Interactive | 93.5 | 41.7 | 65.7 | 34.5 | 1.9 | 39.2 | 0.41
|   | | yactaTreeTracer | Automated | 130.1 | 53.8 | 95.8 | 46.6 | 5.6 | 559.0 | 2.47
|   | | GVFTubeSeg | Automated | 152.1 | 63.0 | 122.4 | 58.4 | 5.0 | 372.4 | 1.44
|   | | WEB2 | Automated | 161.4 | 67.2 | 115.4 | 57.0 | 44.1 | 1873.4 | 7.27
|   | | Iowa-1 | Interactive | 148.7 | 63.1 | 119.2 | 58.9 | 10.4 | 158.8 | 1.19
|  
|
|
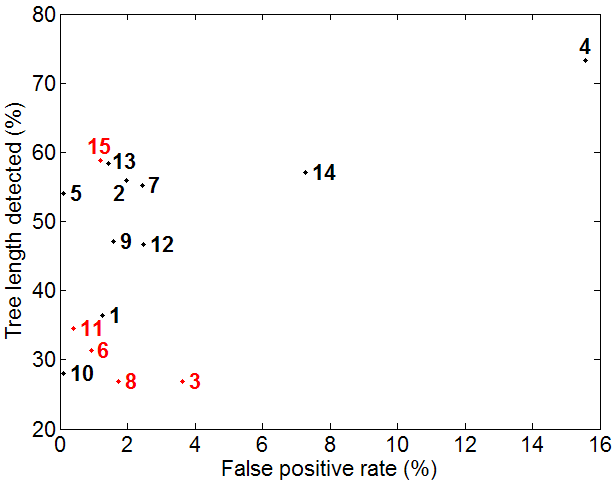
Average false positive rate versus tree length detected of all participating teams, with teams in the semi-automated category in red.

|
| (1) CADTB | (2) ARTEMIS-TMSP | (3) UAVisionLab | (4) NagoyaLoopers | (5) DIKU
| (6) VOLCED | (7) TubeLink | (8) Sevilla | (9) PhilipsResearchLabHamburg | (10) VIA
| (11) ICCAS-VCM | (12) yactaTreeTracer | (13) GVFTubeSeg | (14) WEB2 | (15) Iowa-1
| | |
|
The following table shows the branch count and tree length of the reference for the test cases.
| Branch count | Tree length (cm) |
|
| CASE21 | 200 | 120.26 | 
|
| CASE22 | 388 | 341.48 | 
|
| CASE23 | 285 | 271.32 | 
|
| CASE24 | 187 | 185.78 | 
|
| CASE25 | 235 | 270.15 | 
|
| CASE26 | 81 | 83.17 | 
|
| CASE27 | 102 | 94.35 | 
|
| CASE28 | 124 | 122.04 | 
|
| CASE29 | 185 | 150.29 | 
|
| CASE30 | 196 | 164.35 | 
|
| CASE31 | 215 | 188.41 | 
|
| CASE32 | 234 | 231.36 | 
|
| CASE33 | 169 | 159.57 | 
|
| CASE34 | 459 | 368.83 | 
|
| CASE35 | 345 | 320.37 | 
|
| CASE36 | 365 | 422.60 | 
|
| CASE37 | 186 | 190.32 | 
|
| CASE38 | 99 | 78.16 | 
|
| CASE39 | 521 | 420.14 | 
|
| CASE40 | 390 | 399.31 | 
|
| |
|